
Safety or operational rules are established as Layers of Protections (LOPs) or Operational Event Barriers (OEBs) to minimize injury or operational event rates.
These rules are bypassed in two ways. One way is that the rule of interest neither covers all conditions it intends to cover, nor is it designed adequately to be followed by the workers. The other way is that the rule is bypassed intentionally. The first bypass is caused by inadequate or incomplete rule design. The second bypass is caused by perceptions of the workers that:
- the rule is too burdensome;
- there exists an inducement to bypass the rule;
- the risk of violation (either personal injury or penalty) is too low;
- there is inadequate peer pressure for compliance.
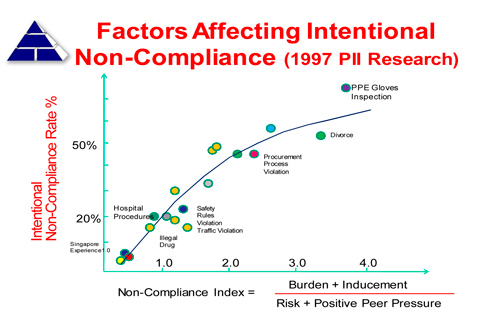
The following figure shows the PII research in rule non-compliance rates.
“Burdensome” means that if compliance of a rule requires burdensome tasks, such as performing an air-tight inspection of insulation gloves before their use, the non-compliance rate would be high. Feeling a task to be burdensome is a perception that the task is not valuable relative to the amount of effort put in to complete it.
“Inducement” means that if there is some level of personal gratification to be achieved by not complying with the rules, such as going home early by using shortcuts to complete the work sooner, the non-compliance rate would be high.
“Risk” means the perceived risk of injury or punishment (or penalty) for non-compliance. Risk is the product of consequence of injury plus punishment and the probability of occurrence. So, if there is a frequent (or even continuous) monitoring of compliance, the probability of catching a non-complier is very high. Therefore, the overall risk is high.
“Positive peer pressure” is the peer pressure among workers to comply with the rules. At some companies, a few life-saving rules are established, such as wearing proper PPE (personal protective equipment) such that if any one of the rules is violated, any co-worker could call for a stop-work. This requirement for workers to monitor one another helps to generate a very high compliance rate, mainly due to positive peer pressure.
The non-compliance index is a quantifiable parameter, based on quantitative values of denominators (risk and positive peer pressure) and numerators (burden and inducement). The higher the levels of perceived burden or inducement, the higher the non-compliance rate. The higher the levels of perceived risk or positive peer pressure, the lower is the non-compliance rate.
The best non-compliance rate for any rule is about 1%.
At the Distribution Business Unit of a major US utility, more than 20 PII consultants undertook a detailed compliance study with field observations of the non-compliance rates of various rules. The results are shown in the following figure.
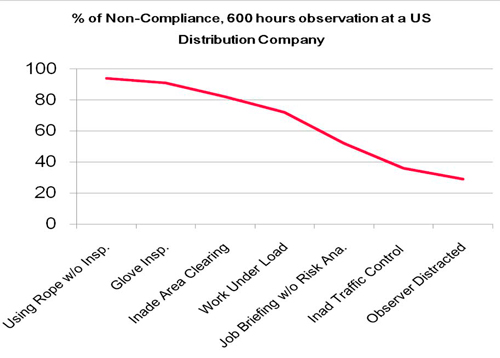
The average non-compliance rates for a few rules (or the layer of protection) observed is about 50%. These rules are generally viewed by the field workers as burdensome, little value added, and carry little non-compliance risk. The non-compliance rates, with field observations, could be determined by assessing the levels of perceptions in burden, inducement, risk, and peer pressure.
The following table lists the questions that PII would use to predict non-compliance rates when actual field observations are not conducted. The non-compliance rates are determined by the answers to the questions.
|
Parameters Affecting Non-compliance Rate |
Observations |
Results |
Scores |
|---|---|---|---|
|
(1) Burden |
Amount of time and efforts needed to implement the requirements of the rule of interest |
High: More than 5% of working time is dedicated to efforts of compliance. |
3 |
|
Medium : Between 1 and 5% of time is dedicated to efforts of compliance |
2 |
||
|
Low: Less than 1% of time is dedicated to efforts of compliance |
1 |
||
|
None |
0 |
||
|
(2) Inducement |
Personal gratification from non-compliance |
High: There is an established or written policy, reward system, and/or management covert statements that bypassing the LOP is rewarded with benefits (time off, money, recognition, etc.) |
3 |
|
Medium: There is an established or written policy, reward system, and/or management covert statements that bypassing the LOP is acceptable. |
2 |
||
|
Low: There is an unwritten policy, reward system, and/or management covert statements that bypassing the LOP is acceptable. |
1 |
||
|
None |
0 |
|
(3) Perceived Injury Risk |
Lesson learned meeting routinely conducted to talk about “injury risk”, that include the specific rule of interest |
Daily |
3 |
|
Weekly |
2 |
||
|
Monthly |
1 |
||
|
None |
0 |
||
|
(4) Perceived Non-compliance Risk |
Supervisory field monitoring time (% of total working time) for compliance rules (including the specific rule of interest) |
>10% |
3 |
|
5%-10% |
2 |
||
|
0-5% |
1 |
||
|
0% |
0 |
||
|
(5) Positive Peer Pressure |
Management expectation of peer intervention when the specific rule (such as life saving rules) is violated |
Formal training on expectation and yearly refresher training |
3 |
|
Initial training and no refresher training |
2 |
||
|
Management statement |
1 |
||
|
None |
0 |
The ratio of (Item 1 Score+ Item 2 Score ) to (Total Scores of Items 3,4, and 5) is the non-compliance index. That is:
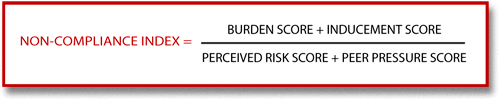
Typical values of the non-compliance index range from 0.0 to 4.0. Where a non-compliance index value is greater than 4.0, the non-compliance is assumed to be 100%.